The weather page contains comprehensive information about conditions at the flying field. The key weather factors are displayed on a series of gauges, while further details can be viewed by hovering over a gauge (or tapping the gauge on a mobile device). Each gauge has both an analogue and digital readout of the relevant metric. The readings are updated every 60 seconds.
Note: On a mobile device, the weather page is best viewed in landscape mode.
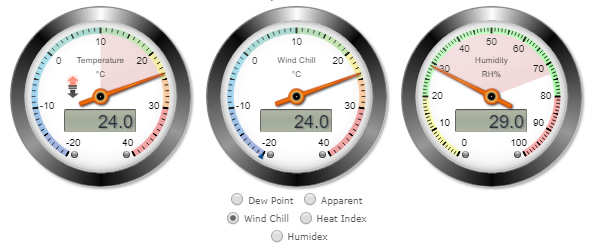
The first row of gauges indicates temperature and relative humidity:

The left gauge indicates current outside temperature (24.0 °C),
The middle gauge indicates either Dew Point, Apparent temperature, Wind Chill effect, Heat Index or Humidex temperature, depending upon which radio button is clicked. In this case, the gauge is showing a Wind Chill temperature of 24.0 °C. Heat Index and Humidex are metrics that combine air temperature and relative humidity in an attempt to determine the human-perceived equivalent temperature — how hot it feels. The human body normally cools itself by perspiration, or sweating, which evaporates and carries heat away from the body. However, when the relative humidity is high, the evaporation rate is reduced, so heat is removed from the body at a lower rate causing it to retain more heat than it would in dry air. Measurements have been taken based on subjective descriptions of how hot subjects feel for a given temperature and humidity, allowing an index to be made which relates one temperature and humidity combination to another at a higher temperature in drier air. The heat index is calculated only if the actual temperature in the shade (not in direct sunlight) is above 27 °C (80 °F). For lower temperatures, Apparent temperature is more appropriate.
The right gauge indicates relative humidity (29%). Note the shaded area on each dial face. This shows the minimum and maximum values recorded to date on the current day.
The second row of gauges indicates wind speed, wind direction and the variance in wind direction during the day:

The left gauge indicates current wind speed (13.3 Km/h), with the 10 minute average of 7.5 km/h as indicated by the shaded green area on the dial face. The shaded pink area represents the 10 minute average wind gust speed of 18.5 km/h. The small triangular marker at 28 km/h shows the maximum gust speed recorded for the day.
The middle gauge indicates current and average wind direction. The current wind direction is shown by the orange pointer (315 deg. i.e. coming from North West), while the blue pointer (behind the orange one) shows the average wind direction over the past 10 minutes (319 deg. i.e. approx NW). The shaded sections on the dial face show the most prevalent wind directions recorded for the current day. The darker the colour, the more frequent this range of direction.
The right gauge is a Wind Rose. It indicates the most prevalent wind directions recorded during the current day, similar to the shaded areas on the middle gauge. However, the radius of each sector varies according to the prominence of that wind direction in relation to the others. The digital readout is the Wind Run. This is a measure of the total distance the winds have travelled, calculated using the recorded wind speeds and the total minutes recorded for each wind speed value.
The third row of gauges indicates rain conditions and estimated cloud base altitude:

The left gauge shows current barometric pressure (1023.6 mb). The shaded areas on the dial face indicate the minimum and maximum average barometric pressure values recorded during the current day.
The left gauge displays total rainfall for the day.
The middle gauge indicates the rain rate (mm/hr) averaged over the past 10 minutes.
The right gauge displays an approximation of how high any possible cloud formation is above ground level. It uses a calculation which gives the theoretical height above ground level at which Cumulus clouds might form, based on the current temperature and dew point. It assumes that the difference between temperature and dew point decreases by about 8 degrees Centigrade per 1000 metre increase in altitude. When the two values coincide, the air is saturated (relative humidity = 100%) and Cumulus clouds may form.